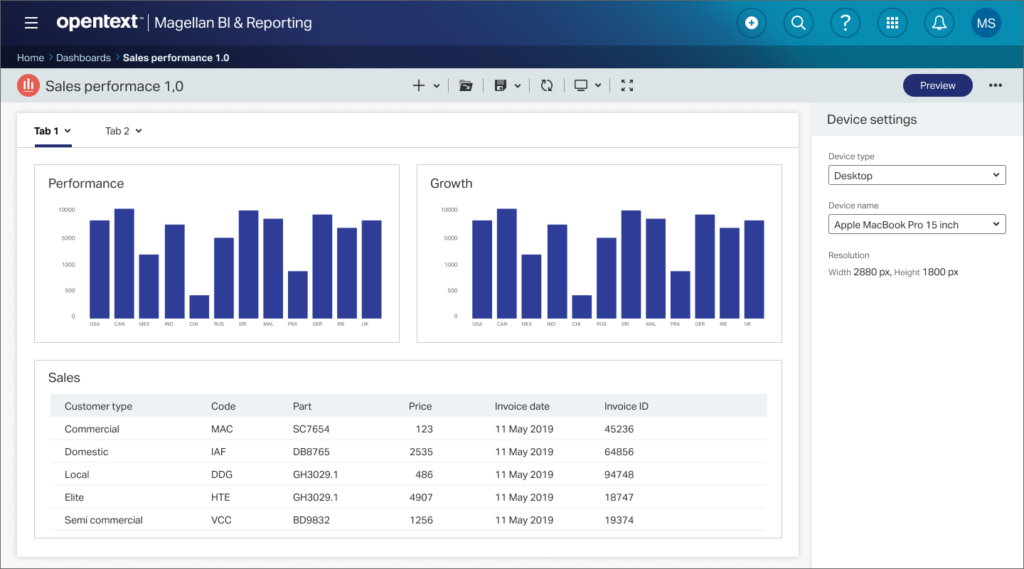
OpenText™ Magellan™ Dashboards is an authoring tool that allows a business user to easily create and customize data-driven dashboards. The graphical summaries of key business metrics empower the user to gain insight of business-critical information. The application aggregates multiple data sources and views into a unified, interactive interface for more precise decision-making at all level of an organization.
The product was initially released in 2010. Even though, it has been evolved over a decade, the goal is for a business user to create and customize data-driven visualizations for easy visual analysis and faster insights. Today the application offers AI-augmented data analytics, easy-to-read real time interactive visualizations, and a data exploration tool.
Responsibilities:
- UX team manager – lead UX works and responsible for project management (prioritize, size and distribute UX tasks), and make sure to deliver UX assets ontime
- Lead and facilitate the alignment of UX goals and vision with cross-functional teams and stakeholders
- Reinforce UX process, methodologies, and research
Moreover, I am also part of the product core team to set product visions and goals.
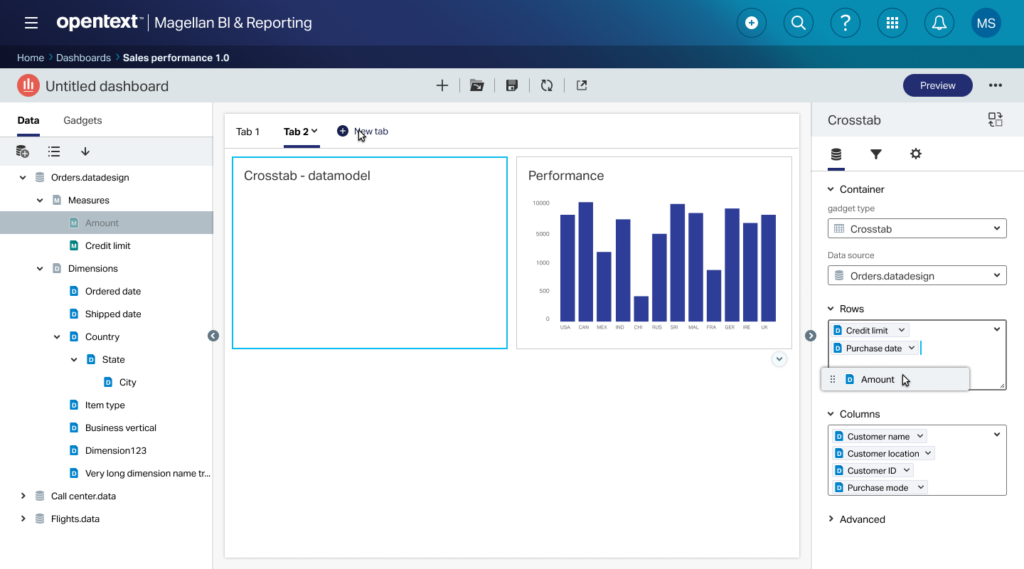
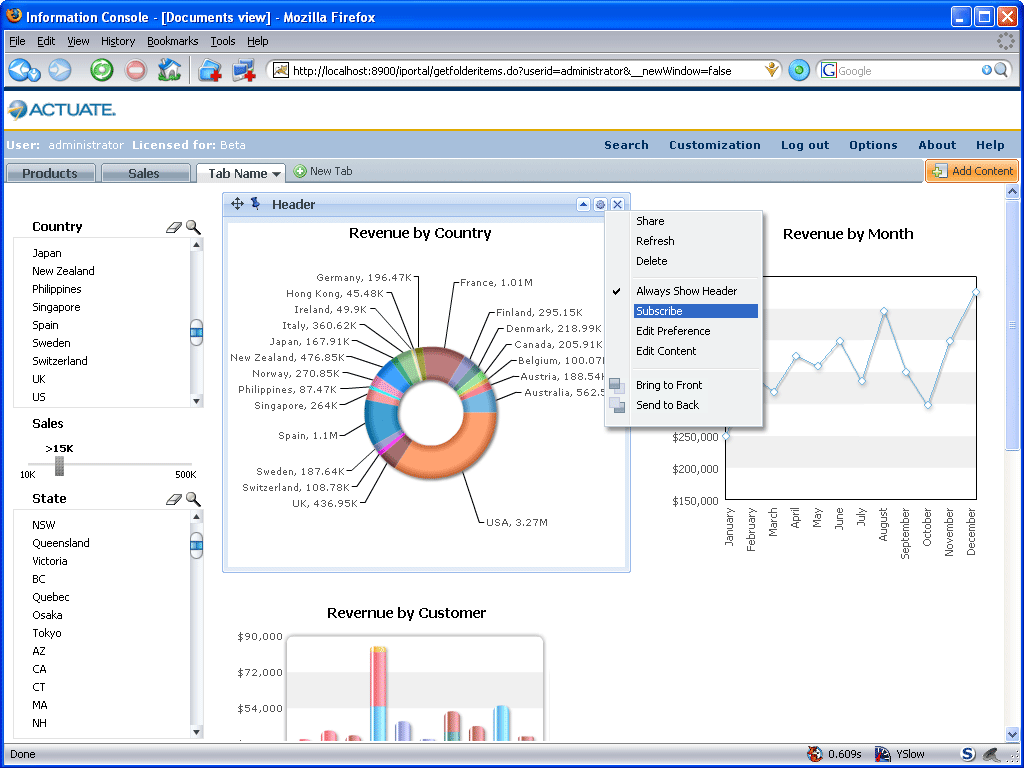
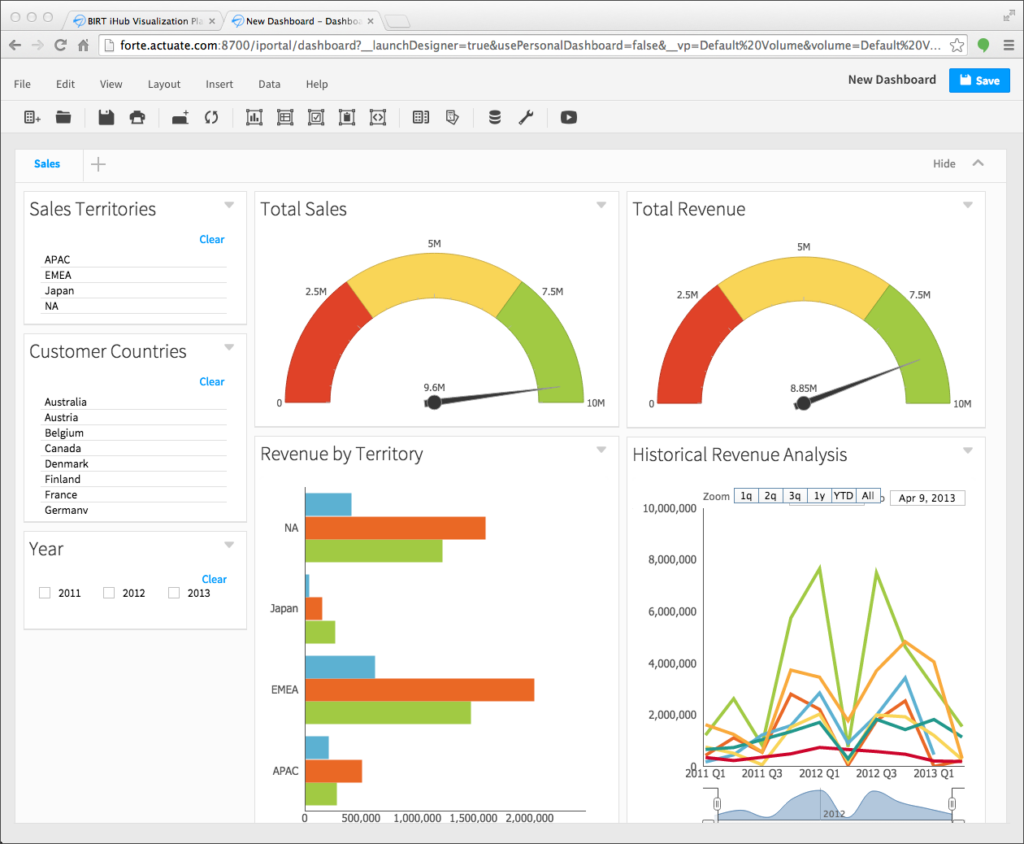
Challenges: To keep the product competitive in the AI&Analytics market is one of the product visions. In comparison to direct competitors; Tableau and Qlik, the 2014 version of the product was predominantly dialog-based and not very business-user friendly. The first time experience was unclear and not intuitive. Moreover, the inability to readily view and explore data in dashboard design interface had disconnection with the user flow.
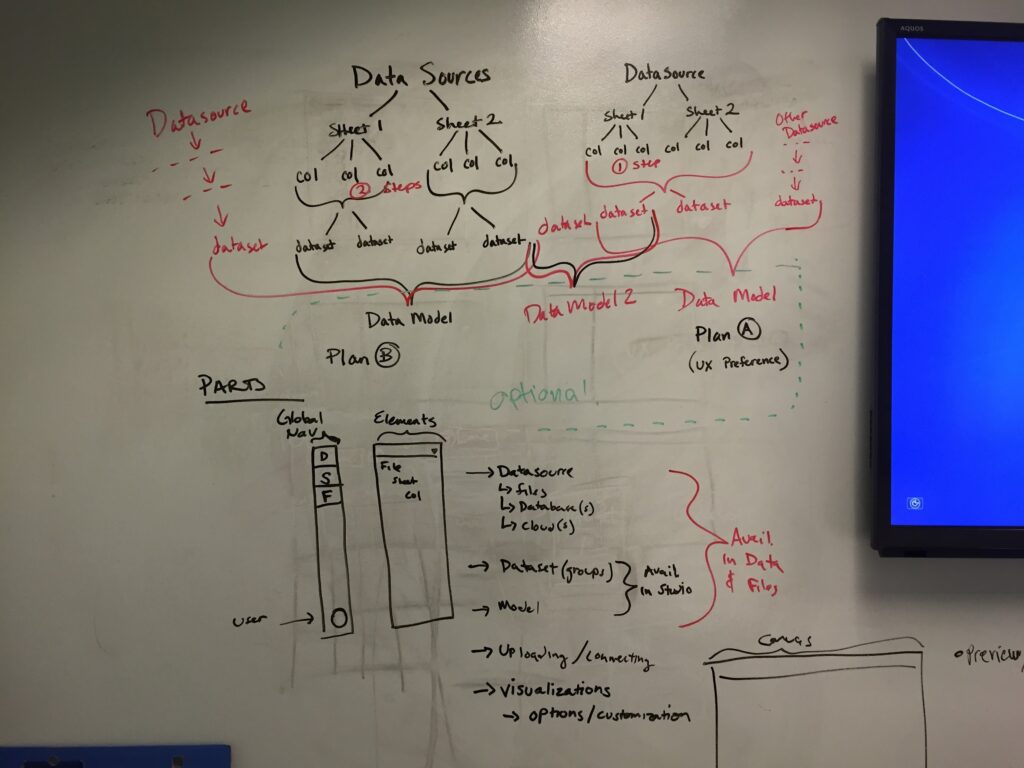
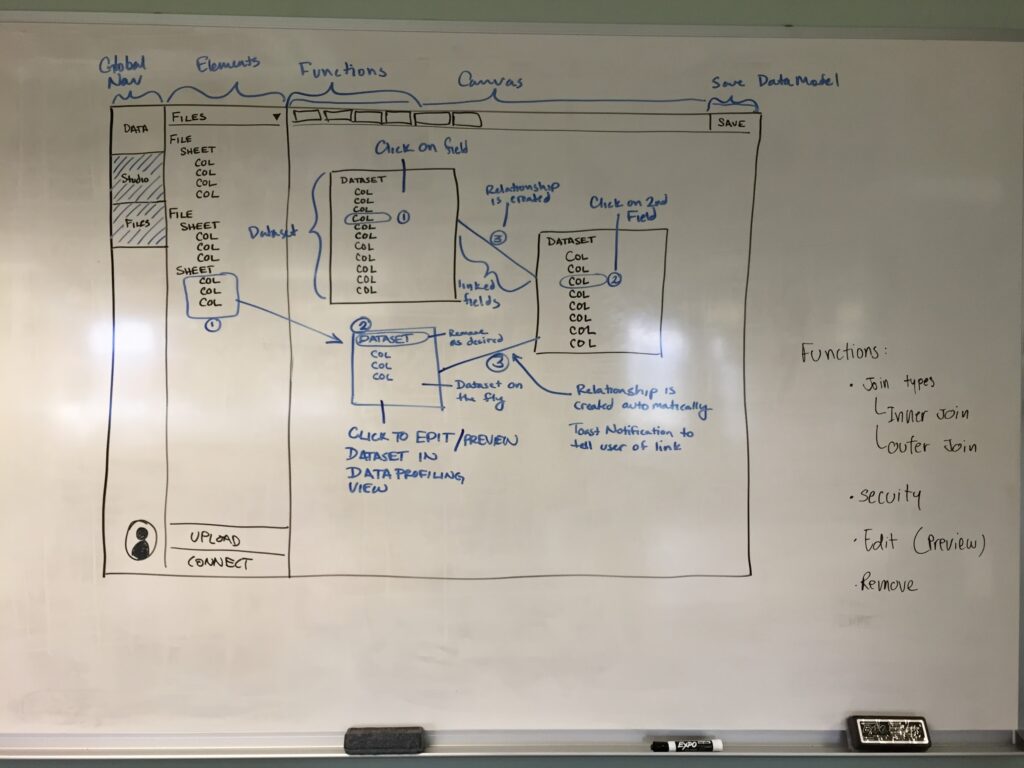
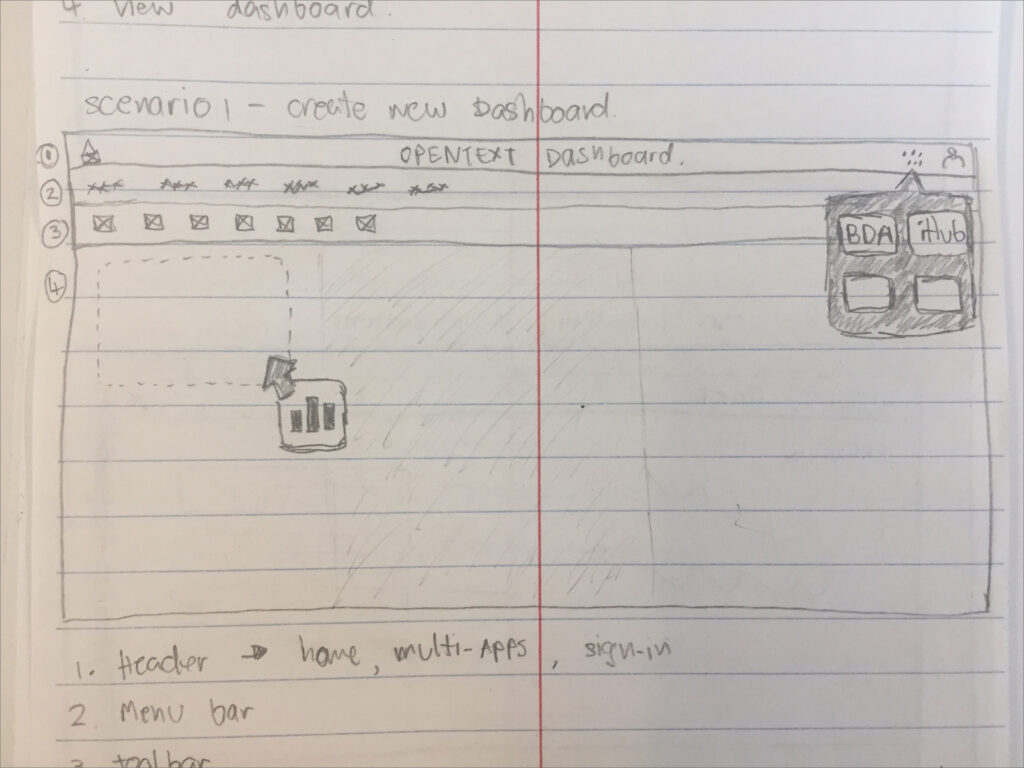
Goals: In 2020, the team has redesigned the product to make it easier for LoB users to author dashboards by moving away from the current dialogs-based experience and towards a truly WYSIWYG experience for defining the visualizations. The team also added algorithm to visualizations (i.e. graphs, tables, maps) making it easy for user to transform and visualize data.
Result:
- Improve customer acquisition and retention rate
- New user groups (business users) are able to onboard quickly and easily with the new and intuitive UIs
- Improve usability scores, NPS and SUS, by 41%
- Achieve more integration within other OpenText products by providing one-stop-shop analytics solutions